Python - 2 つの list から単回帰(1〜4次)計算&比較!
Updated:
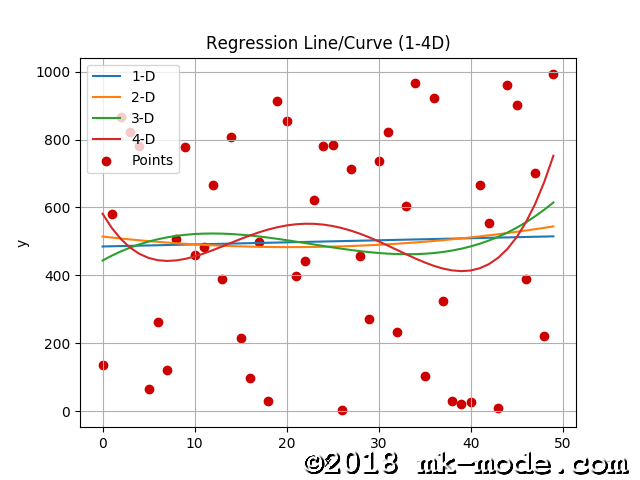
先日、 Python で2つの list から単回帰曲線(二次回帰)を計算するアルゴリズムを実装しましたが、今回は、同じ2つの list で、単回帰直線(1次)、単回帰曲線(2〜4次)を計算して、結果を比較してました。
0. 前提条件
- LMDE 2 (Linux Mint Debian Edition 2; 64bit) での作業を想定。
- Python 3.6.4 での作業を想定。
- 単回帰直線、単回帰曲線の計算には、数値計算ライブラリ NumPy を使用。
- グラフ描画に matplotlib を使用。
- 当方は他のバージョンとの共存環境であり、
python3.6,pip3.6で 3.6 系を使用するようにしている。(適宜、置き換えて考えること)
1. Python スクリプトの作成
- 敢えてオブジェクト指向で作成している。
- Shebang ストリング(1行目)では、フルパスでコマンド指定している。(当方の慣習)
- 毎回同じ結果になるよう
random.seed()を指定している。
File: regression_line_curve.py
1
2
3
4
5
6
7
8
9
10
11
12
13
14
15
16
17
18
19
20
21
22
23
24
25
26
27
28
29
30
31
32
33
34
35
36
37
38
39
40
41
42
43
44
45
46
47
48
49
50
51
52
53
54
55
56
57
58
59
60
61
62
63
64
65
66
67
68
69
70
71
72
73
74
75
76
77
78
79
80
81
82
83
84
85
86
87
88
89
90
91
92
93
94
95
96
97
98
99
#! /usr/local/bin/python3.6
"""
Regression curve
"""
import random
import sys
import traceback
import numpy as np
import matplotlib.pyplot as plt


class RegressionCurve:
    def __init__(self, xs, ys):
        self.xs, self.ys = xs, ys

    def exec(self):
        """ Execution """
        try:
            self.__scatter()  # Scatter given points
            self.__plot_1()   # Plot regression line
            self.__plot_2()   # Plot regression curve(2-D)
            self.__plot_3()   # Plot regression curve(3-D)
            self.__plot_4()   # Plot regression curve(4-D)
            self.__show()     # Graph showing
        except Exception as e:
            raise

    def __scatter(self):
        """ Scatter given points """
        try:
            print("x={}\ny={}".format(self.xs, self.ys))
            plt.scatter(self.xs, self.ys, c='#cc0000', label="Points")
        except Exception as e:
            raise

    def __plot_1(self):
        """ Plot regression line """
        try:
            a, b = np.polyfit(self.xs, self.ys, 1)
            print("a={:.4f}, b={:.4f}".format(a, b))
            fs = [a * x + b for x in self.xs]
            plt.plot(self.xs, fs, label="1-D")
        except Exception as e:
            raise

    def __plot_2(self):
        """ Plot regression curve (2-D) """
        try:
            a, b, c = np.polyfit(self.xs, self.ys, 2)
            print("a={:.4f}, b={:.4f}, c={:.4f}".format(a, b, c))
            fs = [x * (x * a + b) + c for x in self.xs]
            plt.plot(self.xs, fs, label="2-D")
        except Exception as e:
            raise

    def __plot_3(self):
        """ Plot regression curve (3-D) """
        try:
            a, b, c, d = np.polyfit(self.xs, self.ys, 3)
            print("a={:.4f}, b={:.4f}, c={:.4f}, d={:.4f}".format(a, b, c, d))
            fs = [x * (x * (x * a + b) + c) + d for x in self.xs]
            plt.plot(self.xs, fs, label="3-D")
        except Exception as e:
            raise

    def __plot_4(self):
        """ Plot regression curve (4-D) """
        try:
            a, b, c, d, e = np.polyfit(self.xs, self.ys, 4)
            print("a={:.4f}, b={:.4f}, c={:.4f}, d={:.4f}, e={:.4f}"
                  .format(a, b, c, d, e))
            fs = [x * (x * (x * (x * a + b) + c) + d) + e for x in self.xs]
            plt.plot(self.xs, fs, label="4-D")
        except Exception as e:
            raise

    def __show(self):
        """ Graph showing """
        try:
            plt.title("Regression Line/Curve (1-4D)")
            plt.xlabel("x")
            plt.ylabel("y")
            plt.legend(loc=2)
            plt.grid()
            plt.show()
        except Exception as e:
            raise


if __name__ == '__main__':
    try:
        random.seed(1)
        xs = list(range(0, 50))
        ys = [random.randint(0, 1000) for _ in range(50)]
        obj = RegressionCurve(xs, ys)
        obj.exec()
    except Exception as e:
        traceback.print_exc()
        sys.exit(1)
2. Python スクリプトの実行
まず、実行権限を付与。
$ chmod +x regression_line_curve.py
そして、実行。(最後にグラフを表示)
$ ./regression_line_curve.py
x=[0, 1, 2, 3, 4, 5, 6, 7, 8, 9, 10, 11, 12, 13, 14, 15, 16, 17, 18, 19, 20, 21, 22, 23, 24, 25, 26, 27, 28, 29, 30, 31, 32, 33, 34, 35, 36, 37, 38, 39, 40, 41, 42, 43, 44, 45, 46, 47, 48, 49]
y=[137, 582, 867, 821, 782, 64, 261, 120, 507, 779, 460, 483, 667, 388, 807, 214, 96, 499, 29, 914, 855, 399, 443, 622, 780, 785, 2, 712, 456, 272, 738, 821, 234, 605, 967, 104, 923, 325, 31, 22, 26, 665, 554, 9, 961, 902, 390, 702, 221, 992]
a=0.6090, b=484.9788
a=0.0746, b=-3.0468, c=514.2254
a=0.0128, b=-0.8636, c=15.1565, d=443.6742
a=0.0019, b=-0.1730, c=4.9496, d=-46.6775, e=581.3755
3. グラフ確認
以下のようなグラフが表示される。

以上

Comments