Ruby - gnuplot でグラフ描画!
Updated:
Ruby で容易にグラフを描画できる RubyGems ライブラリ gnuplot を使用してみました。
RubyGems ライブラリ gnuplot は、2次元や3次元のグラフを描画するためのコマンドラインツール Gnuplot を Ruby で使用できるようにラップしたものです。
0. 前提条件
- Linux Mint 17.1(64bit) 一般ユーザでの作業を想定。
- Ruby 2.2.2-p95 での作業を想定。
- Gnuplot インストール済みであること。(Linux Mint - Gnuplot でグラフ描画!)
1. RubyGems パッケージのインストール
$ sudo gem install gnuplot
2. 動作確認
2-1. 作成例・1
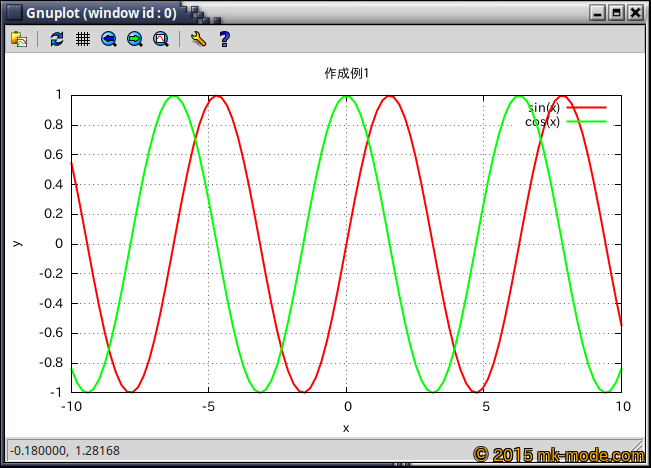
単純な\(sin\)曲線・\(cos\)曲線を描画する例。
File: gnuplot_1.rb
1
2
3
4
5
6
7
8
9
10
11
12
13
14
15
16
17
18
19
20
21
22
23
24
25
#! /usr/local/bin/ruby
#-----------------------------------------------
# Ruby script to draw a graph by gnuplot.(Ex.1)
#-----------------------------------------------
require 'gnuplot'

Gnuplot.open do |gp|
  Gnuplot::Plot.new(gp) do |plot|
    plot.xrange "[-10:10]"
    plot.title  "作成例1"
    plot.xlabel "x"
    plot.ylabel "y"
    plot.grid

    plot.data << Gnuplot::DataSet.new("sin(x)") do |ds|
      ds.with      = "lines"
      ds.linewidth = 2
    end

    plot.data << Gnuplot::DataSet.new("cos(x)") do |ds|
      ds.with      = "lines"
      ds.linewidth = 2
    end
  end
end
そして、実行権限を付与して実行。
$ sudo chmod +x gnuplot_1.rb

$ ./gnuplot_1.rb
Gnuplot ウィンドウが開き、グラフが描画される。

但し、環境によってはこのウィンドウを閉じようとしてもうまく閉じれないかもしれない。(termnal が “wxt” の場合。 terminal が “x11” 等なら閉じれるが、日本語は使用できない)
ちなみに、本家の gnuplot では、この問題は “Close” を “exit” でなく “exit gnuplot” にバインドすれば解決するようだが、今回の RubyGems ライブラリでは通用しない模様。(試行してみた結果)
2-2. 作成例・2
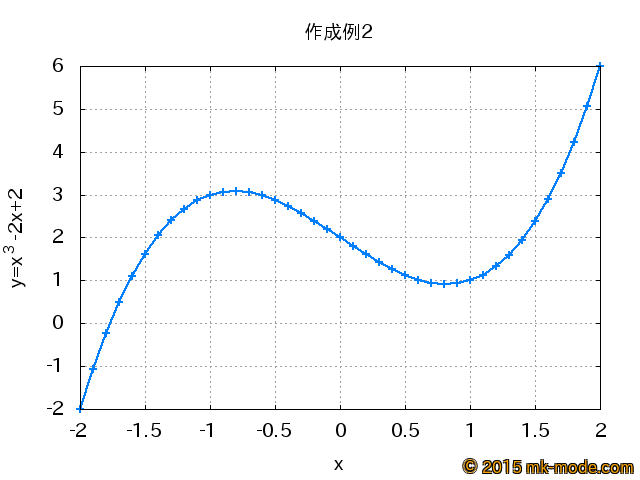
\(y=x^3 - 2x + 2 \ (x={-2.0,-1.9,\cdots,1.9,2.0})\)のグラフを PNG ファイルに描画・出力する例。
File: gnuplot_2.rb
1
2
3
4
5
6
7
8
9
10
11
12
13
14
15
16
17
18
19
20
21
22
23
24
25
26
#! /usr/local/bin/ruby
#-----------------------------------------------
# Ruby script to draw a graph by gnuplot.(Ex.2)
#-----------------------------------------------
require 'gnuplot'

Gnuplot.open do |gp|
  Gnuplot::Plot.new(gp) do |plot|
    plot.terminal "png enhanced font 'IPA P ゴシック' fontscale 1.2"
    plot.output   "gnuplot_2.png"
    plot.title    "作成例2"
    plot.xlabel   "x"
    plot.ylabel   "y=x^3-2x+2"
    plot.grid

    x = (-20..20).collect { |v| v.to_f / 10.0 }
    y = x.collect { |v| v ** 3 - 2 * v + 2}

    plot.data << Gnuplot::DataSet.new([x, y]) do |ds|
      ds.with      = "linespoints"  # 点のみなら "points"
      ds.linewidth = 2
      ds.linecolor = 3
      ds.notitle
    end
  end
end
そして、実行権限を付与して実行。
$ sudo chmod +x gnuplot_2.rb

$ ./gnuplot_2.rb
“gnuplot_2.png” というファイルが出力される。

2-3. 作成例・3
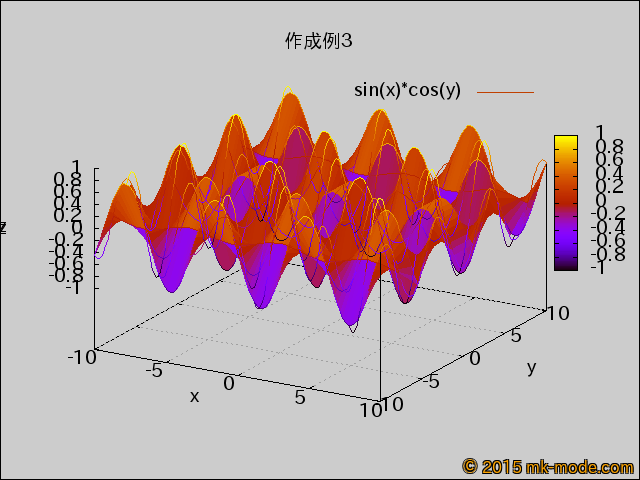
\(z=sin(x)cos(x)\)の三次元グラフを PNG ファイルに描画・出力する例。
File: gnuplot_3.rb
1
2
3
4
5
6
7
8
9
10
11
12
13
14
15
16
17
18
19
20
21
22
23
24
25
26
27
#! /usr/local/bin/ruby
#-----------------------------------------------
# Ruby script to draw a graph by gnuplot.(Ex.3)
#-----------------------------------------------

require 'gnuplot'

Gnuplot.open do |gp|
  Gnuplot::SPlot.new(gp) do |plot|
    plot.terminal "png enhanced font 'IPA P ゴシック' fontscale 1.2"
    plot.output   "gnuplot_3.png"
    plot.set      "object 1 rect from screen 0,0 to screen 1,1 fc rgb '#D0D0E0' fillstyle solid 1.0 behind"
    plot.title    "作成例3"
    plot.xrange   "[-10:10]"
    plot.yrange   "[-10:10]"
    plot.xlabel   "x"
    plot.ylabel   "y"
    plot.zlabel   "z"
    plot.pm3d
    plot.grid

    plot.data << Gnuplot::DataSet.new("sin(x)*cos(y)") do |ds|
      ds.with      = "lines"
      ds.linecolor = 6
    end
  end
end
そして、実行権限を付与して実行。
$ sudo chmod +x gnuplot_3.rb

$ ./gnuplot_3.rb

参考サイト
Ruby で処理した得た数値をグラフ化することが多い場合は重宝するでしょう。
以上。

Comments